As we all know, Excel is a widely used application in industries for maintaining a wide range of data, calculations, and growth stats. However, it is not an easy task to maintain huge data as it always has scope for error. Adding standard deviation bars can significantly boost your ability to interpret & communicate data accurately. In this blog, I will show you how to add standard deviation bars in Excel in a step-by-step process.
So, keep reading the article and follow the steps shortlisted as per your device.
To fix corrupted Excel files, we recommend this tool:
This software will prevent Excel workbook data such as BI data, financial reports & other analytical information from corruption and data loss. With this software you can rebuild corrupt Excel files and restore every single visual representation & dataset to its original, intact state in 3 easy steps:
- Try Excel File Repair Tool rated Excellent by Softpedia, Softonic & CNET.
- Select the corrupt Excel file (XLS, XLSX) & click Repair to initiate the repair process.
- Preview the repaired files and click Save File to save the files at desired location.
Understanding the Standard Deviation
In statistics, the standard deviation is a measure of variation in a set of values. It offers visions into how much separate data facts deviate from the mean. However, the standard deviation bars generally represent the visual deviation, giving you a clear picture of the data’s distribution.
In simple words, standard deviation bars are helpful in conveying the reliability & precision of your data.
Benefits of Using Standard Deviation Bars
There are numerous advantages of using standard deviation bars in Excel, some of them are as follows:
- Visual Illustration of Variability- The standard deviation bars assist in visually representing the variability of datasets.
- Quantifying Uncertainty- It measures the amount of dispersion in a set of values.
- Enhanced Data Interpretation- Standard deviation bars provide a clear & concise mode to interpret the data in complex datasets.
- Support for Error Bars- In MS Excel, deviation bars allow users to represent a margin of error around each data point.
- Decision-Making Support- It contributes to decision-making by offering a clearer representation of the data distribution.
How to Add Standard Deviation Bars in Excel (Windows)?
The Excel for Windows operating system procedures below explain how to add a Standard Deviation bar to your charts and graphs. Please be aware that the ensuing procedure was created specifically for users of Office 2013 or newer versions:
- The spreadsheet with your chart and data should be opened. If you do not already have one, start a new spreadsheet, enter your data, and then make the chart you want before moving on.
- Select the chart by making a single click on it.
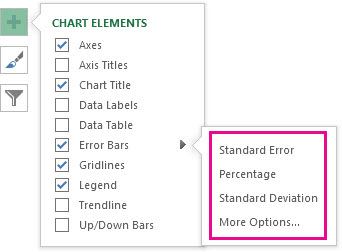
- The chart denoted by a Plus sign can be opened by selecting the Chart Elements button, then selecting the Error Bars checkbox.
- Select Standard Deviation by clicking on an arrow next to the Error Bars.
- Click the More Items button and select the options if you want to specify your amounts. Keep in mind that the sort of chart you’re using affects the orientation of error bars.
Also Read: How to Automate Repetitive Tasks in Excel?
How to Add Standard Deviation Error Bars in Excel Mac?
The procedure for adding a Standard Deviation bar to your Excel for Mac charts and graphs is outlined below. Please be aware that the ensuing procedure was created specifically for users of Office 2013 or newer versions. Some stages may be different in earlier versions.
- The spreadsheet with your data and chart should be opened. If you do not already have one, start the latest spreadsheet, enter your data, and then make the chart you want before moving on.
- Select the chart by making a single click on it.

- Go to the Ribbon header’s Chart Design tab.
- In the far left of the Ribbon, select Add Chart Element from the drop-down menu.
How to Add Standard Deviation Error Bars in Excel 2007-2010?
Standard Deviation bars still work in older versions of Excel. However, Office 2013 places them in a different place. Use the methods below to add this error bar to your spreadsheets if you are using an earlier release.
- The spreadsheet with your data and chart should be opened. If you do not already have one, start the latest spreadsheet, enter your data, and then make the chart you want before moving on.

- Select the chart by making a single click on it.
- Your Ribbon header should contain the Layout tab. Locate the Error Bars dropdown menu here, and then click it once.
- Select Error Bars with Standard Deviation from the menu.
Common Mistakes to Avoid When Using Standard Deviation Bars in Excel
Though standard deviation bars are influential, it is important to be aware of potential pitfalls:
- Using unsuitable datasets for analysis.
- Mistaking the bars as the absolute values.
- Ignoring the scale of your data.
Also Read: Open Excel in Safe Mode: The Lifesaver for Excel Spreadsheets
Related FAQs:
Are Standard Deviation Bars Suitable for All Types of Data?
Yes, standard deviation bars suitable for various types of data in Excel, providing insights into data variability.
Why Are Standard Deviation Bars Used?
Standard deviation bars are generally used to represent the visual deviation, giving you a clear picture of the data distribution.
Can Standard Deviation Bars Be Customized for Specific Visual Preferences?
Yes, standard deviation bars can be customized for specific visual preferences.
How Often Should I Update My Excel Software to Access the Latest Features Related to Standard Deviation Bars?
It is recommended to update your Excel software on a regular basis to stay up-to-date of the latest improvements, ensuring optimal functionality.
Do Standard Deviation Bars Work Well with Large Datasets?
Absolutely, standard deviation bars work well with both small and large datasets.
Conclusion:
This is all bout how to add standard deviation bars in Excel. Here I tried my best to list down the complete steps to add standard deviation bars in Excel on Windows and MAC OS. Follow the step-by-step instructions to represent the data in your Excel file accurately. Moreover, if your Excel file is corrupted, you can use this professionally recommended Excel File Repair Software to fix corrupt XLS and XLSX files.
You can now follow us on our Facebook, or Twitter pages and share your queries related to Excel errors, corruption, data recovery, and others; our experts will get back to you.
Good Luck..!
Priyanka Sahu
Priyanka is a content marketing expert. She writes tech blogs and has expertise in MS Office, Excel, and other tech subjects. Her distinctive art of presenting tech information in the easy-to-understand language is very impressive. When not writing, she loves unplanned travels.