MS Excel is the spreadsheet program that is frequently used to format and organize the large amounts of data. Not only this, Excel is also packed with various shapes galleries in order to make flowcharts.
In this tutorial guide, we will discuss how to create a flowchart in Excel to illustrate relationships between all your data points and for giving more clarity to your Excel spreadsheet.
Before that, let’s grab some basic knowledge about Excel Flowcharts.
To repair & recover corrupted Excel file, we recommend this tool:
This software will prevent Excel workbook data such as BI data, financial reports & other analytical information from corruption and data loss. With this software you can rebuild corrupt Excel files and restore every single visual representation & dataset to its original, intact state in 3 easy steps:
- Try Excel File Repair Tool rated Excellent by Softpedia, Softonic & CNET.
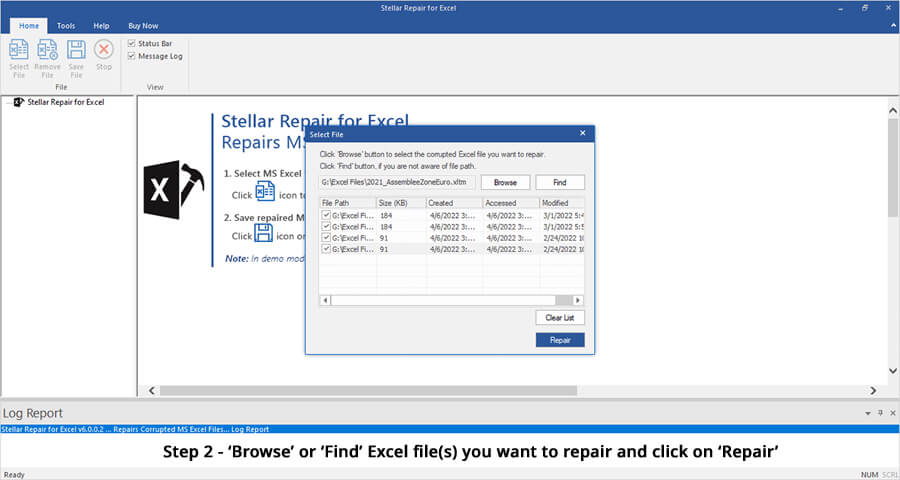
- Select the corrupt Excel file (XLS, XLSX) & click Repair to initiate the repair process.
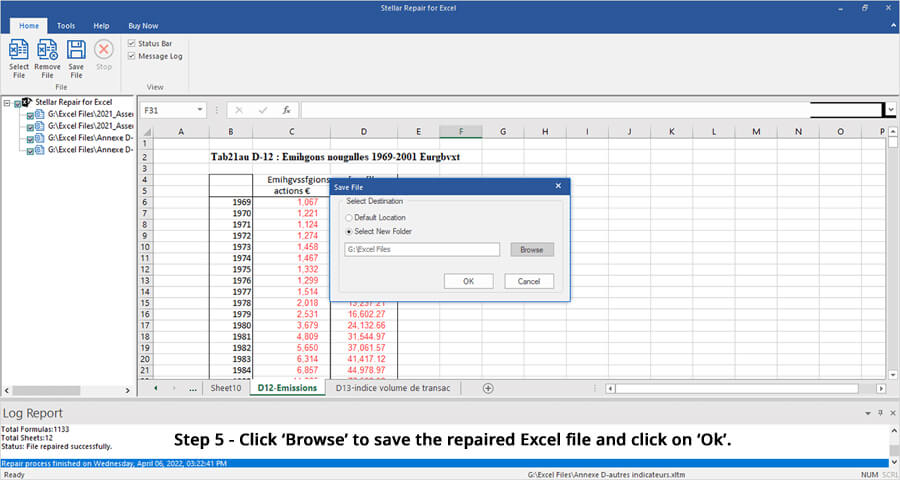
- Preview the repaired files and click Save File to save the files at desired location.
What is Flowchart & Why it is Used?
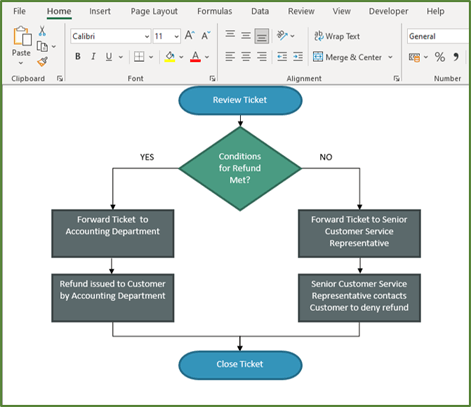
A flowchart is a visual representation to elaborate the entire process flow in an easier way which will ultimately help you to identify errors and avoid unnecessary steps. All in all, flowcharts play a very important role in defining and analyzing the complete process.
Each and every process step is represented by some symbol. These symbols are connected with arrows showing the process’s flow direction.
For example – you are working with your team on some projects and then making use of the flowchart to help in the easy visualization of your project.
Even the system analysts, engineers, programmers, and managers use this flowchart for easy illustration of the following things:
- Data flow
- System operation flows
- Document workflows
- Algorithms.
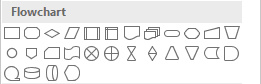
Here are the compulsory elements required for creating flowcharts in Excel.
| Round corner Rectangle is mainly used at the time beginning and exiting in a flowchart. | |
 |
The box having straight corners is used to input process stages |
 |
Parallelogram helps to illustrate the input/output of data |
 |
The diamond represents conditional branching |
| Arrow is used to show the process flow |
Also Read: 4 Ways To Create Drop-Down List In Excel
How to Create a FlowChart In Excel?
Method 1: Draw a Flowchart In Excel
For those who want to use different shapes and add complex topology in flowchart for them, it’s better to draw their own flowchart.
- Go to the Insert tab, and then from the Illustrations group, choose the Shapes tab:

- From the Shapes list go to the Flowchart group. Select the item which you prefer:
- To add text in the selected shape, just double-click in it and enter the text.

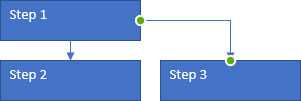
- To connect the shapes perform the following task:
Go to the Insert tab and after that from the Illustrations group hit the Shapes list. Now choose any type connectors from the “Lines” group:
![]()
For easy customizations of connectors and shapes and connectors, check out our next section on how to change connector type for flowcharts in Excel.
How To Change Connector Type For Flowchart?
In flowcharts, workflow diagrams are used by connectors to make connections between various stages and elements.
But several similar types of connecting lines give your chart a very messy look. You can easily combine different types of connectors that represent semantically other types of transitions.
For changing the types of connectors, here are the steps that you need to perform:
- Make a right-click over the connector appearing in your flowchart design.

- After that, from the popup menu hit the Connector Types list.

- Here you will see various types of connectors so choose the one which you like. This will change the connector type.
Also Read: 3 Ways To Create Calendar In Excel
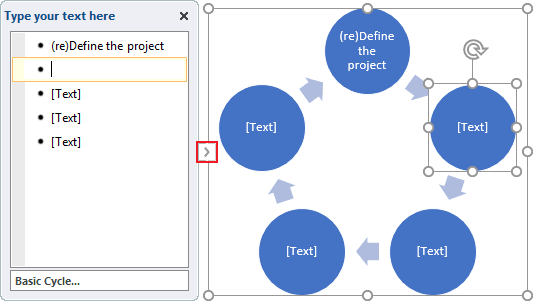
Method 2: Create Flowchart In Excel Using SmartArt
Excel provides its user with several flowchart designs. All these designed templates are available in SmartArt options.
- Open the Excel worksheet to which you want to add the flowchart.
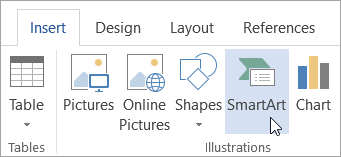
- Hit the Insert tab and then from the Illustrations group choose the Very soon you will see the dialog box of SmartArt Graphic seems to be opened on your screen.
- Choose the Process which is present in the left pane.
- Select the flowchart template you like.
- Choose the OK option.

After performing these steps a new basic flowchart starts appearing on your Excel spreadsheet.
Customize The Flowchart
Now you have got the basic structure of your flowchart through this template. So the only thing left to do is customize the flowchart. Also, learn how to create a flowchart in Excel with SmartArt.
For customizing your SmartArt flowchart here are the things that you need to do:
- Choose the flowchart blank area for activating the SmartArt Tools.
- To change the color: go to the SmartArt Tools Design >> Change Colors.


- For adding text in the shapes: choose the shape and then type the text within it. Hit the Enter button.
- For adding more shapes:
1. choose the shape that you need to connect as the new shape.
2. Go to the SmartArt Tools Design and choose the drop-down arrow present across the Add Shape.

3. Select the area where you need to insert the new shape.
Note: For all the flowcharts entire Add Shape options are not available.
- For changing up the flowchart layout: go to the SmartArt Tools Design after that from the Layouts group choose one option.

- In order to modify the shapes in your flowchart: make a right-click on the shape and then go to the change Shape. Just select the shapes you need to apply.
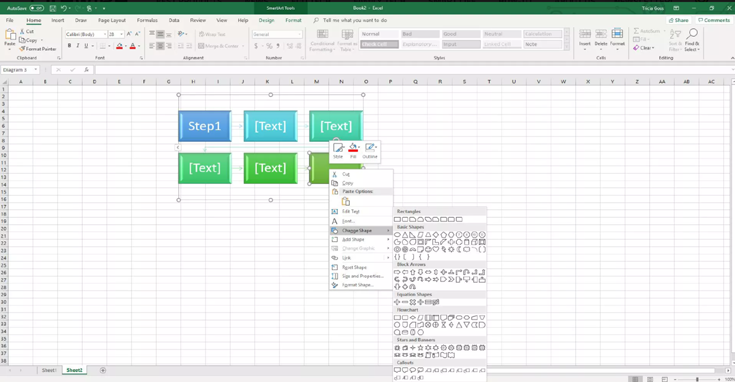
- Now save your worksheet after making complete changes.
Tips To Work Flawlessly With Excel Flowcharts:
- If you need to apply line breaks in some points within the text then keep holding the Alt key down while pressing the Enter key.
- By making use of standard toolbar buttons you can format the text present within the shape.
- Autoshapes present inside the Insert > Shapes section doesn’t get integrated with the Smart Art shapes. Both these shapes can’t join by the lines and formatting tools are also different.
- If shapes remove the text at the time of printing, then try grouping the entire shapes before proceeding towards the printing procedure.
This problematic bug is also found in Excel 2007 version. It is also found at the time of PDF creation and printing drivers.
Best Software To Recover Corrupt Excel File Data
If unfortunately, you ended up losing your Excel file data either due to corruption or deletion here is the solution to fix this issue i.e. Excel Recovery Tool, This software helps you to recover deleted, corrupted, or lost Excel files even without any backup. Not only this it is also capable to repair corrupt, damaged Excel (XLS and XLSX) files and fixing Excel errors as well.
With this, you can recover charts, chart sheets, tables, cell comments, images, cell comments, formulas, and sort & filter and all data components from corrupt Excel files.
- Quickly recover and repair both .xls and .xlsx files.
- Easily restore multiple corrupted Excel files simultaneously.
- Restore everything including worksheets, cell comments, worksheet properties, charts, and other data.
- Too easy to use so that even a novice user can also use it.
- Supports both Windows as well as Mac operating systems.
Steps to Utilize MS Excel Repair Tool:


Related FAQs:
Is It Easier to Create a Flowchart in Word or Excel?
Yes, of course, it is easier to create a flowchart in Word as well as Excel. But if we compare both the applications for the experience of creating flowchart, we will not recommend you to create flowcharts in Word as it is annoying. It is recommended to use Excel to make an Excel flowchart as it is packed with various shapes galleries.
Are There Flowchart Templates in Excel?
Yes, there are different flowchart templates available in MS Excel. To find them, you have to:
- Open Excel >> go to an Insert tab.
- Under an Illustrations group >> choose SmartArt option.
- This will open the SmartArt Graphic dialog box.
- Here, Choose Process and select the template of the flowchart that you wish to use.
What Is the Easiest Way to Create a Flowchart?
No matter whether you are the MS Excel, Word or PowerPoint user, the best and easiest way for creating flowcharts is to use the SmartArt.
Also Read: How To Use Dynamic Data Labels To Create Interactive Excel Charts?
Wrap Up:
Lastly, I want to conclude that Excel is the best platform to create flowcharts. The “SmartArt” tools and “Shapes” option are ideal for how to create a flowchart in Excel.
In the first option, you will get a chance to your creativity in representing data using flowcharts. Whereas, in the second option you will get the pre-designed templates in which you need to make small changes.
I hope this article seems helpful to you….!

Priyanka Sahu
Priyanka is a content marketing expert. She writes tech blogs and has expertise in MS Office, Excel, and other tech subjects. Her distinctive art of presenting tech information in the easy-to-understand language is very impressive. When not writing, she loves unplanned travels.